Liquid Cooling Infrastructure Integration: The 2026 Definitive Guide
Liquid cooling infrastructure integration the thermodynamic limits of air-cooled data centers are no longer a theoretical concern for the future; they are a present-day operational ceiling. For decades, the industry relied on the relative simplicity of moving chilled air through perforated floor tiles to manage the thermal output of standardized server racks. However, the rise of high-density accelerated computing has introduced a power-to-heat ratio that air, as a medium, simply lacks the heat capacity to resolve. When a single server chassis begins to exceed 2 kilowatts and a rack scales toward 100 kilowatts, the volume of air required to maintain safe operating temperatures would necessitate wind speeds that are physically impractical within a confined facility.
The shift toward liquid-based thermal management represents a fundamental departure from the “Box-in-a-Room” philosophy. It requires a holistic reimagining of how energy enters and exits the building envelope. Liquid cooling is not merely an alternative to fans; it is an integration of mechanical plumbing, chemical engineering, and structural architecture directly into the heart of the silicon stack.
Navigating this transition involves far more than simply selecting a cooling method. It requires a forensic understanding of secondary loops, coolant distribution units (CDUs), and the long-term chemical stability of the fluids used. This inquiry serves as a definitive reference for architects, engineers, and infrastructure strategists who must bridge the gap between legacy air-cooled environments and the high-performance liquid-cooled facilities of the next decade.
Liquid Cooling Infrastructure Integration
To master Liquid Cooling Infrastructure Integration is to recognize that thermal management is now the primary bottleneck of digital scale. In a professional editorial context, this integration is defined as the seamless marriage of the building’s primary water loop with the rack-level secondary loop, ensuring that heat is transferred from the processor to the external environment with the lowest possible thermal resistance.
Multi-Perspective Explanation
From the perspective of a mechanical engineer, the integration is a “Mass-Flow Challenge,” focusing on the Reynolds numbers and pressure drops across the cold plates. From the view of a facility operator, it is a “Plumbing and Risk Challenge,” where the presence of water in a data hall necessitates new leak detection and preventative maintenance protocols.
Oversimplification and Risks Liquid Cooling Infrastructure Integration
Liquid cooling infrastructure integration a common oversimplification is the “Bolt-on” fallacy—the idea that liquid cooling can be treated as a modular upgrade to an air-cooled room. In reality, the weight of liquid-filled racks often exceeds the structural floor load capacity of older facilities, and the requirement for a secondary fluid network demands a different floor-to-ceiling clearance. The risk of ignoring the “Holistic Hydronic Path” is a system that works at the rack level but fails at the facility level because the primary building pumps cannot handle the variable flow rates required by high-performance clusters.
Deep Contextual Background: The Thermal Wall
The history of data center cooling has moved through three distinct eras. The “CRAC/CRAH Era” (Computer Room Air Conditioning) prioritized high-volume air movement and was sufficient for racks up to 15 kW.
The primary driver for this evolution is “Heat Flux Density.” Modern GPUs and TPUs concentrate so much energy in a small surface area that the “Thermal Resistance” of an air-cooled heatsink—no matter how large—is too high. By using liquid, we can maintain a lower “Junction Temperature” on the chip, which not only prevents thermal throttling but actually extends the lifespan of the silicon. This shift is not just about efficiency; it is about enabling the physical existence of the next generation of compute.
Conceptual Frameworks and Mental Models Liquid Cooling Infrastructure Integration
To analyze high-density liquid systems with professional depth, we utilize specific mental models:
1. The “Approach Temperature” Framework
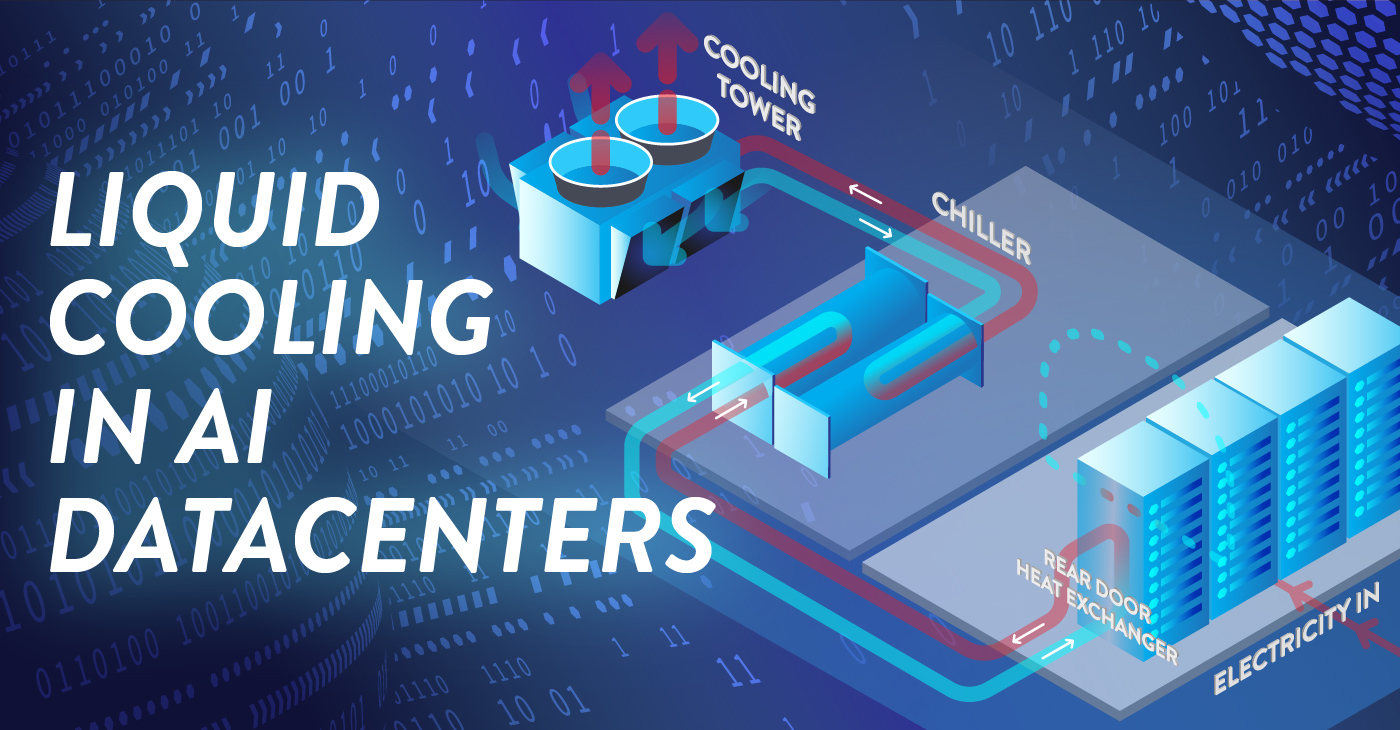
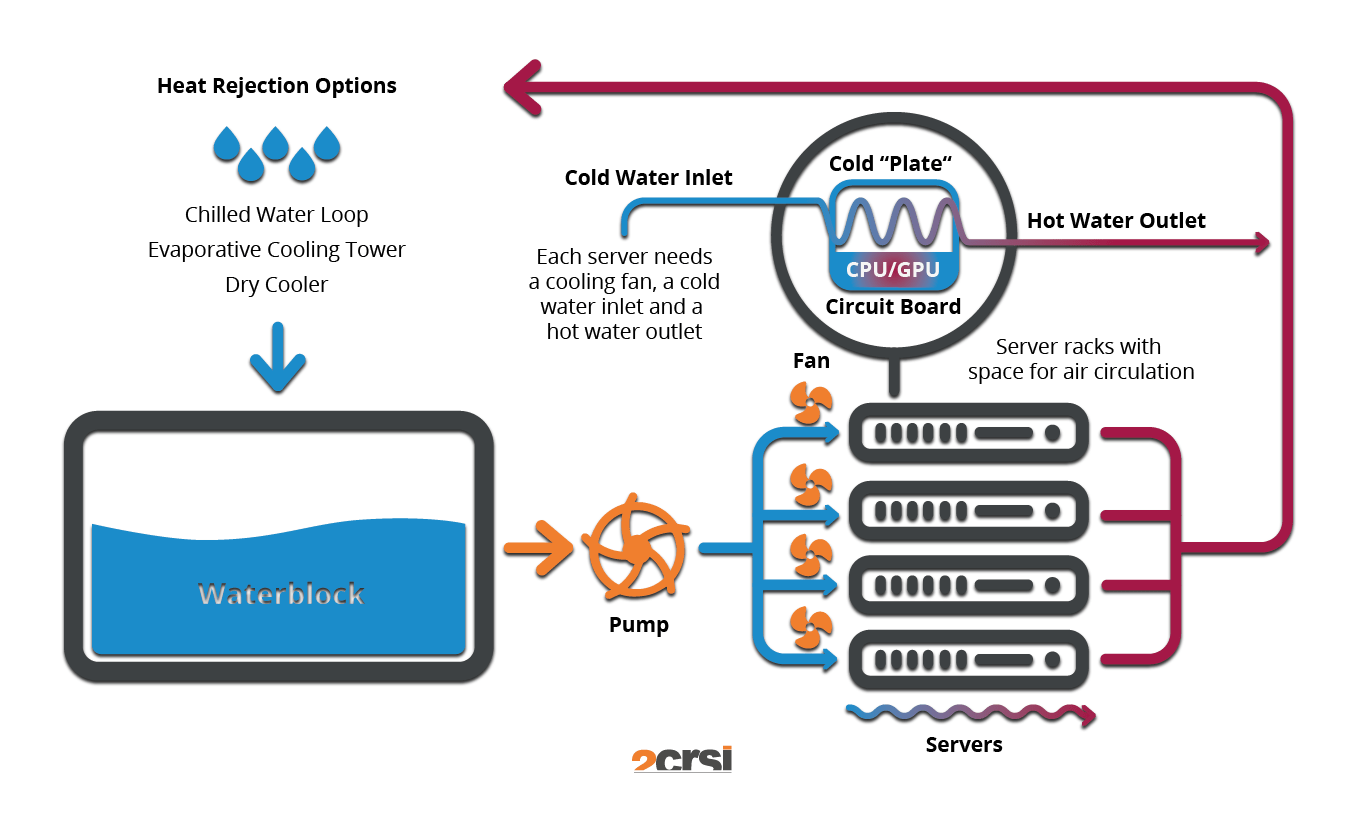
This model evaluates the efficiency of the heat exchange process. It is the difference between the temperature of the fluid entering the cold plate and the temperature of the processor. A “Tight” approach temperature means the system is highly efficient, allowing the facility to use “Warm Water Cooling” (up to 30°C or 32°C), which eliminates the need for energy-intensive chillers and allows for 100% free cooling in most climates.
2. The “Loop Separation” Principle
Reliable liquid cooling relies on the separation of the primary (building) loop from the secondary (rack) loop. The CDU acts as the “Heart” and the “Firewall,” ensuring that any contaminants or pressure spikes in the building’s massive water system do not reach the sensitive micro-channels on the cold plates.
3. The “Heat Reuse” Model
Unlike air-cooled systems where heat is diffused and “Low-Grade,” liquid systems produce “High-Grade” heat (45°C to 60°C). This framework views the data center as a thermal plant, where the cooling return water can be integrated into district heating networks or industrial processes, turning a waste stream into a revenue stream.
Key Categories: Material and Mechanical Typologies
Integrating liquid systems requires a taxonomy of technology based on the “Wetness” of the contact.
Realistic Decision Logic
The decision to utilize Liquid Cooling Infrastructure Integration is driven by the “Rack Density Horizon.” If a facility anticipates more than 30% of its racks exceeding 40 kW, a “Greenfield” liquid-first design is often more cost-effective than attempting a complex hybrid retrofit that forces air and water systems to share limited floor space.
Detailed Real-World Scenarios Liquid Cooling Infrastructure Integration
Scenario 1: The “Galvanic Corrosion” Event
A mid-sized provider integrates liquid cooling using a mix of copper cold plates and aluminum manifolds in the secondary loop.
-
The Conflict: Within 12 months, the aluminum manifolds begin to leak due to “Dissimilar Metal” contact.
-
The Root Cause: The dielectric fluid’s inhibitor package was exhausted, allowing ions to facilitate galvanic corrosion.
-
The Solution: Standardizing on all-copper or all-stainless steel “Wetted Parts” and implementing quarterly fluid chemistry analysis.
Scenario 2: The “Seismic Mass” Challenge
A provider in a high-seismic zone installs 100 immersion tanks.
-
The Symptom: The building’s structural engineer flags that the floor slabs are deflecting beyond safe limits when the tanks are filled.
-
The Outcome: The tanks must be moved to the ground floor “Slab-on-Grade,” requiring a complete redesign of the electrical and plumbing runs.
-
The Lesson: “Wet Weight” (fluid + hardware + tank) must be the primary variable in the initial structural design.
Planning, Cost, and Resource Dynamics
The economics of liquid integration are characterized by a “Front-End Premium” that is recovered through “Resource Intensity Reduction.”
Range-Based Table of Integration Costs
Tools, Strategies, and Support Systems
Managing a “Wet” data hall requires a digital-to-physical monitoring stack:
-
CDU Management Software: Real-time monitoring of secondary loop pressure to identify “Micro-Leaks” before they become catastrophic.
-
Vacuum-Based Leak Protection: Systems that operate the secondary loop at “Negative Pressure,” ensuring that if a tube is punctured, air is sucked in rather than liquid leaking out.
-
Automated Water Chemistry Dosing: Tools that monitor pH, conductivity, and biological growth in real-time, automatically injecting inhibitors.
-
Blind-Mate Manifolds: Drip-free connectors that allow for “Hot-Swapping” of servers without draining the entire rack loop.
-
Flow Meters & Balancing Valves: Ensuring that every rack in a row receives the exact amount of coolant required, preventing “Thermal Starvation” in the furthest racks.
-
CFD for “Residual Air”: Modeling the airflow for components (like PSU and VRMs) that aren’t touched by the liquid loop.
-
Secondary Containment Troughs: Physical barriers beneath the piping runs to catch and divert any catastrophic fluid release.
-
Digital Twins of the Hydronic Loop: Simulating the impact of a pump failure on the entire cluster’s thermal ceiling.
Risk Landscape and Failure Modes Liquid Cooling Infrastructure Integration
The “Risk Profile” of liquid integration involves “Cascading Physical Failures.”
-
The “Air Pocket” Blockage: If a system is improperly “Purged” of air during commissioning, air bubbles can become trapped in the cold plate micro-channels, leading to localized “Hot Spots” and silicon failure.
-
Condensation (The “Dew Point” Trap): If the coolant temperature is lower than the ambient dew point in the room, moisture will condense on the pipes. This is the primary reason why high-density liquid systems use “Warm Water” (above 25°C).
-
Bio-Fouling: In poorly maintained systems, algae or bacterial growth can clog the filters and CDUs, slowly strangling the system’s cooling capacity.
Governance, Maintenance, and Long-Term Adaptation
A liquid-cooled facility requires a shift from “IT Maintenance” to “Industrial Process Maintenance.”
-
Review Cycles: Monthly fluid conductivity checks; annual “Pressure Testing” of all secondary loop connections.
-
Adjustment Triggers: If the “Differential Pressure” across the CDU filters increases by 10%, it triggers a mandatory filter swap.
-
The Layered Checklist:
-
Continuous: Automated leak detection alarms integrated with the BMS (Building Management System).
-
Quarterly: Visual inspection of “O-rings” and gaskets for signs of drying or embrittlement.
-
Annually: Recalibration of flow meters to ensure the hydronic balance is maintained.
-
Measurement, Tracking, and Evaluation
How do you measure “Liquid Excellence”?
-
Leading Indicators: “Partial PUE” (pPUE) of the cooling subsystem and “WUE” (Water Usage Effectiveness).
-
Lagging Indicators: Mean Time Between Failures (MTBF) of the pump systems and average CPU/GPU junction temperatures.
-
Qualitative Signals: “Noise Floor” reduction—a liquid-cooled hall should be significantly quieter than an air-cooled one.
-
Documentation Examples:
-
The “Water Quality Log”: A digital record of the chemical state of the facility loops.
-
The “Hydronic Map”: A live visualization of flow rates and pressure drops across the data hall.
-
Common Misconceptions and Industry Myths
-
Myth: “Liquid cooling uses more water.”
-
Reality: Because liquid is so much more efficient, it often reduces total facility water consumption by allowing for the use of “Dry Coolers” rather than evaporative towers.
-
-
Myth: “Immersion cooling is the only way to reach 100 kW.”
-
Reality: Direct-to-chip (cold plate) systems are currently capable of managing over 120 kW per rack with proper manifold design.
-
-
Myth: “Water in the data center is a new risk.”
-
Reality: Data centers have had water in the form of “Chilled Water” pipes for decades; liquid cooling just brings the water 12 inches closer to the chip.
-
-
Myth: “Dielectric fluids are forever chemicals.”
-
Reality: Modern synthetic oils and fluorochemicals are increasingly formulated for low Global Warming Potential (GWP) and high biodegradability.
-
Conclusion
The transition to Liquid Cooling Infrastructure Integration is the bridge between the enterprise data centers of the past and the high-density AI power plants of the future. It is a transition that replaces the brute force of spinning fans with the elegant precision of fluid dynamics. To succeed, an organization must treat the cooling loop as an extension of the motherboard—a critical, high-fidelity system that requires rigorous governance and specialized engineering. As silicon continues to push toward its thermal limits, the ability to manage the flow of heat will become the ultimate differentiator in the race for computational authority.